Showing posts with label Sales. Show all posts

Wednesday, June 20, 2018

Low Friction Products; Touch-and-go Development

composite image of modern TV remote control next to an Apple iPod music player
Guess which one of these two products was designed by engineering experts. This is not a trick question. I am being as serious as a heart attack.
For many years, engineers have been designing ever more complex remotes. Technological features have become the dominant factor in product development to the dismay of consumers. So it took for a group of non-expert outsiders to come up with a simple handheld device that would be capable of hundreds of functions; all with just two buttons. The rest, as they say, is history.
The iPod started it's product development life by ignoring all industry expert assumptions and went on to become the first member in a very successful family of products. The resulting Apple products reached every segment of the consumer population; thus shattering any and all sales metrics.
How? By assuming that the experts were wrong and that humans were right, Apple designers went away from the prevailing product development dogmas and focused instead on what any human would find simple to use. Their method went well beyond focusing on ergonomics. The remote to the left has buttons hierarchically located, shaped and colored with the exact goal of achieving great ergonomic performance; or at least that is what the experts that created it thought.
On the other hand, the iPod focuses on the elimination of all friction. Like with any long lasting machine, low operational friction was the key. By being simple to interface with, the iPod is a much more welcoming product that the usual TV remote control. But do we think that remote control companies have learned a lesson? No way! Long established dogmas are hard to leave behind.
This begs the question: how do you do product development? What is your focus?
color image of 'Why We Buy' book by Paco Underhill
Why We Buy by Paco Underhill
After a couple of decades of product development experience, it surprises me how often I come across products that ignore friction. These products are difficult to be placed in stores. Their packaging makes it difficult to sell. And, as if things weren't bad enough, users find them difficult to use. In other words, there is friction around every aspect of product supply-chain and performance.
Paco Underhill in 'Why We Buy' covers many of the behavioral nuances that matter most to consumers. While Paco strongly focuses on retail-anthropology, there are many valuable angles to be understood about how users feel and think.
But I guess that I should not be surprised with under-performing products everywhere. Most products are designed based on a consumer need. As long as they solve a problem consumers have, product development engineers completely ignore all else. This might have been enough years ago. Still, today we play by high performance rules.
Think of it within the following context. Let's say that I am on a boat that capsizes away from port. As I try to stay alive, I have access to one of the most effective lifesavers in the industry; the most clever and feature-loaded product. The problem is that it isn't clear how it's supposed to be used. It is so advanced that it requires the equivalent to a college degree before it can be used. So, I die.
Have you noticed that most consumers don't take advantage of most of your product features? Do you wonder why? In a way you are leaving them stranded.
color image of Clayton Christensen's book 'Innovator's Dilemma'
Innovator's Dilemma
by Clayton Christensen
Often the problem is that you confuse progress with evolution. To the many remote control engineers out there, more features is progress. To their customers, it just turns a bad design into something much worse.
First, let's get something clear. If you have a Cash Cow, a product that makes you lots of money with little effort thanks to the fact that it is well established among your customers, don't ever attempt to turn it into a disruptor. You won't be able to. Clayton Christensen, in his fantastic book 'Innovator's Dilemma', clearly demonstrated how companies are trapped by their existing product successes. To then assume that radical change can be made to such Cash Cows would be both, foolish and wasteful. So, identify these Cash Cows as soon as possible and make sure that your best designers create efficient face-lifts and product extensions that can keep the product fresh but without ever killing the golden goose or your development budget. Efficiency is the key. Don't waste time or money fixing your old mistakes. Keep the money coming in and move on.
color image of 'Blue Ocean Strategy' by Renée Mauborgne and W. Chan Kim
'Blue Ocean Strategy'
by Renée Mauborgne and W. Chan Kim
Meanwhile, look at new unsolved product design opportunities and come up with industry disruptors that demonstrate that you can design low friction products. Renée Mauborgne and W. Chan Kim describe in 'Blue Ocean Strategy' the kind of mindset needed to find new angles that can become competition-proof over the long run. This is important because, the longer that you can play in a new field without competition, the easier it will be to ensure recovering your investment and reaching profitability.
Still, success can be achieved even if your new product faces a low barrier of entry into the category. As long as you stick to low friction designs, your product will retain the advantage.
To create a successful new product or service begin by clearly laying out consumer needs. Keep meetings short. Most product managers force their team members to use their brain's neocortex to come up with smart solutions. They ask them to consciously think. But while the most advanced part of the brain is great with simple decision making, it is horrible with complex, multidimensional problems. Instead, saturate the team with data and end the meeting early. It's a touch-and-go strategy. Meet again the next day and do another touch-and-go session where you give them more data. End the meeting by asking each member to bring sketches of any ideas they may have to the next day's meeting. So far, both meetings have taken less than half an hour in total.
For the next meeting, have each member present any new ideas they came across. This is the third time that you will be passing information in a touch-and-go form. But now, you will ask two people or teams, depending on the size of your group and the importance of the project, to come up with a way to bring all the ideas together. This methodology periodically results in four to five very viable and innovative approaches to address consumer needs.
Touch-and-go DevelopmentNext, bring in average people and ask them to identify friction. Ask them to note the areas that are cryptic and difficult to understand or use. Bring the findings to the whole team once again as part of another touch-and-go session. Ask the team members to once again come up with sketches of any ideas they may have. End the meeting quickly by asking two people to put the ideas shown together.
With less that two hours-worth of total meeting time, you should be close to having a new low friction product and a new company culture.
Make sure that packaging, pricing and all supporting marketing materials go through the same process to ensure low friction through out.
As experience grows, low friction products and services will be easier to develop.
The best product development isn't about the company, packaging colors or technological features. No. To do fantastic products, experts must bathe in humility and realize that they know nothing. They must put technology aside and listen to the signals that help us understand how it is that humans function. Successful product development is about frictionless products and services that grant ease access to all with the need. The key phrase among all these thoughts is: to give access.


PS.
I have written a couple of other articles on the books discussed in this article:

Innovator's Dilemma
Clayton Christensen
2013 Top 20 Business Books List (Part II)

Why We Buy
Paco Underhill
2013 Top 20 Business Books List (Part I)

Why We Buy
Paco Underhill
Paco - Shopping and Anthropology

Sunday, January 14, 2018

Low Friction Marketing

Ice skater in orange and black quickly moving right with the text "low friction marketing" on black letters on the rightWhat does marketing mean to your organization? Is marketing an operational expense or a profit center? The difference is not academic. It can mean leaving thousands or millions of dollars in profits on the table. In fact, marketing should be a leveraged asset to your company; it should transform a small operational investment into a much larger bottom-line improvement, today and overtime.
Exceptional marketing transcends the sum of marketing activities. This is a case where the 'whole' is much larger than the parts. Two companies can easily invest the same time  and money into equivalent marketing activities and still achieve completely different results.
Female Millennial Marketing Guru taking a selfie with extreme body languageSo how to know the difference? Let's start from the beginning. You hire a marketing expert. She looks the part; from fashionable dressing, to accentuated body language, to chic enunciation. All her descriptions rely on colorful images that seem to float in midair. Her marketing strategy is loaded with the latest trends in social media. Needless to say, it's hard to argue against any of it.
But how effective is all that? A little over 12 Years ago, marketing gurus exulted the value of Flash coding. Flash promised to be a fantastic way to make your website stand out over the crowd while making it much more interesting and entertaining. Thankfully, time proved that your online consumers don't have the attention characteristics of a two-year-old. After every website in the planet attempted to maximize the use of Flash, the hyperactive graphics slowed downloading and made them all look commonly noisy and annoying. Rather than standing over the crowd, they all became the crowd.
Today, we have worked our way back into the time-tested method of simplicity. The almost pale looking websites of today are easier to read and navigate. There's a lot to be said about simple and effective messaging.
Composite image in black and white of made up add for AMC Pacer with the text "New AMC Pacer. The first wide small car".
Yes, time proved that Flash gurus were wrong. This is because time is a ruthless judge. Almost all the must-have marketing trends of yesterday have reverted over time. Even AMC's Pacer was revered by the gurus after its launch. Disgusting indeed. I anticipate that the same reversion to the mean awaits the must-have trends of today. Regression from these extremes is normal.
But how is it possible? Aren't we a society that constantly demands progress? Don't we need marketing to evolves at the same pace as technology? Well, the answer is no. As for the reason, it's a simple one. Humans don't evolve at the same rate as technology. Our bodies have hardly changed for the last million years. While our mental processing has increased, we're doing it with the same old hardware.
Meanwhile, our environment is as noisy as ever. The number of things clamoring for our attention have certainly increased. As a result, it's simple and clear messages that gain our attention.
Composite image over white background of a pile of remotes on the left and an iPod on the right.
Think of the fact that tens of thousands of the most brilliant engineers and marketers continue to design ever more complex remote controllers for the many electronics around us. Every extra button promises to open a gate to a new feature. Moreover, consumer electronic manufacturers argued that a dependency on specifications made innovative technology intrinsically male. In other words, a larger number of buttons meant a higher degree of masculinity. Not surprisingly, they were very wrong. Remote control users, male and female, continued to ignore most of such buttons. Average users relied on a few familiar buttons for their operational needs. This meant that, to most people, most evolutionary changes in technology remained unnecessary.
And then something brilliant took place. Apple introduced the iPod. A little electronic gizmo smaller than most remotes. Remarkably, the iPod needed only two buttons to give access to a plethora of features and functions. The rest, as they say, is history. A revolution in consumer acceptance took place. Apple's products, lacking technological superiority over their competitors, became incredibly successful thanks to their simplicity. Contrast this with the fact that NOKIA phones where once the most advanced cell phones in the pre-smartphone era. Still, NOKIA sales in the biggest market in the world, the US, failed against all metrics. Apple's experience demonstrated that a holistic approach to marketing is paramount. It's essential to understand users and their nature. Humans gravitate towards simplicity.
In engineering terms, we're talking about low friction interfaces between the technology and the user. Any engineer will easily understand the idea that low friction is essential when designing a mechanical device. An engine with too many rods, exchangers, transformers and connections will result in excessive friction and a subsequent loss of energy. Aside from being deficient, the engine will inevitably self-destruct.
Generally, low friction is achieved through minimalist designs. In the same way, the conversion from technology to user experience goes through different interfaces that can result in predicted losses and perhaps catastrophic failure. This is what happens when your products and services are rejected by consumers regardless of innovation value.
BOSE makes some of the lowest quality consumer electronics products in the world. Have you ever heard professionals in the industry say "no highs, no lows, must be BOSE?" Still, these guys are masters of low friction selling, marketing and use. As a result, their consumers love BOSE widgets so much that they're willing to certify their affinity by paying the highest price premiums in the industry. Yes, BOSE like Apple know the bottom line value of low friction marketing.
But isn't marketing only about advertising and using social media? Again, no. Opening an Apple device is such an experience that hundreds of people document the process and share it over YouTube for anyone to see. Look it up. This means that properly designed packaging can give so much satisfaction as to create a viral wave. Talk about marketing effectiveness. Two companies create packaging at the same expense. One goes unnoticed while the other increases sales by transforming packaging into a profit center.
The American Marketing Association defines marketing as "creating, communicating, delivering, and exchanging offerings that have value for customers, clients, partners, and society at large." They have clearly adopted the holistic view. Notice that their definition is not limited to just creating demand for a product or service. It is also worth considering the fact that they're not saying anything about social media which is today's buzzword everywhere.
composite image of "fired"sign on the left and steve jobs at the right, all over white background.Look at any marketing job description today and you will find that every one of them demands search engine optimization (SEO) and social media excellence. Under such conditions, Steve Jobs would never land a marketing job. Both SEO and social media reflect expertise on database and algorithm design. Neither have anything to do with understanding human nature; something that separated Steve Jobs from the rest.
Before our ubiquitous use of smart phones and tablets as personal assistants, Apple had a product called Newton that require a stylus. There's no doubt that the Newton deployed the latest and technology at that time. Still, Steve Jobs discontinued the product because the need for a stylus meant that consumers couldn't use their fingers to operate it. The stylus was an unwelcomed additional step in the user's experience. Steve Jobs waited until touchscreen technology made the iPad and iPhone possible. To create incredible success, Steve Jobs focused on human nature rather than technology.
composite image of social media names and logos in the background and two black and white people covering their ears in front of itBut can all job listings demanding SEO and social media expertise be wrong? Is it possible that social media is useless? Unfortunately the answer isn't so simple. Yes, most human resource departments are blinded by the social media fad. The noise is deafening in this zero-sum game.
Yet, social media use doesn't have to be a waste of time. Consider one of the most expensive kitchen utensils available in the market: a Bledtech blender. Yes, even something as basic as the time-tested kitchen blender can become exciting enough to go viral. But simply going viral isn't valuable enough. Real value resides in the tens of thousands of consumers who happily opened their wallets to pay a five-times premium for one of these machines. Blendtec created a series of YouTube videos that highlighted the durable nature of their blenders. Through a simply-produced series of videos, viewers can indulge all their destructive desires as anything from cubic zirconia to iPhone's are pulverized by a Blentec blender. Everything becomes liquefied; literally. Even Costco couldn't ignore the videos'effectiveness. In a world of highly commoditized products with perpetually lower profits, Blendtec found a path to extreme profits and a much wider distribution network than would normally be the case for such a niche product. Throughout, Blendtec's advertising costs remain very low by all marketing standards.
And then there's those who spend just to spend. It's said that Coca-Cola knows that 50% of their marketing budget is wasteful. Their problem is that they don't know which 50%. Don't make the same mistake. Many companies treat marketing expenses as pacifiers. Their leaders are emotionally satisfied only after continuing to spend on the same untested marketing efforts. Department managers are giving their marketing budgets with the expectation that they will spend all the funds. This is detrimental to your bottom line and produces no value to society. Everybody loses.
image of farmer following a herd of sheep.In a nutshell, understand your users, consumers, partners, distributors, buyers, sponsors and even your own salespeople. Focus on their fundamental nature. Make products and services that they all can resonate with. Communicate such resonating values to all of them in a simple and succinct fashion. Reduce all interface frictions. Measure all performance and don't waste your money. Finally, don't follow the herd and deploy low friction marketing. To be remarkable and effective, it's essential that your marketing stays clear of all trend noise and lands precisely over the fundamental human nature.

Wednesday, May 4, 2016

The Canary in the Industrial Mine

A picture in black and white of the kind of Canaries used in the coal mines.
The Canary in the Industrial Mine
People across the nation seem to know that something is wrong. Yet, the media continues to collude with the Obama administration in their attempt to hide what's clear to all: the economy never recovered.
While the eerie feeling that something bad is about to happen is pervasive, most find it challenging to know exactly what causes it? After all, the stock market boomed higher and higher, right? Well, yes. But like with all other asset bubbles, higher equity prices don't guarantee value. Just remember that homes went up in price not because of a higher value to society but because there was too much speculative money chasing the homes available. The same is happening with stocks. How do I know? It's easy. There is simply no national economic activity to talk about. And to make things worse, capital spending since the White House scared the hell out of businesses has remained at zero. In other words, there has been no investment in future productivity.
When looking at our GDP, we all know that the president got a free ride thanks to the fracking revolution that took us from being a heavy oil importer to energy independent. All the buildup that saw Texas go through an incredible economic boom took place not because of Obama's support for hydrocarbons but despite of his direct opposition. I wrote about this in a previous article.
Dark Graph of the (FRED) Federal Reserve's Industrial Productivity Index
Fed's Industrial Production Index
Yet, outside of our oil renaissance, industry in general remained quiet. When looking at the government's own data on industrial productivity, it is clear that we never recovered. The Federal Reserve's chart to the left shows that industrial activity in the US has followed a very different path than that from the stock market. While technically we went back and touched the pre-recession top, we didn't achieve any such thing in real terms; after accounting for the eroding effects of inflationary pressures. After adjusting for inflation, we simply have yet to reach levels achieved by the Bush administration.
You don't have to believe shadowstats.com and their estimate of what the Industrial Production Index would look like after removing the effects of inflation. Their chart below uncovers our countries terrible economic performance. Still, we could at least acknowledge that in real terms the so called recovery would be much more anemic than what is suggested by the FED's chart. If so, it is safe to conclude that there has been no recovery.
Dark Graph of Shadowstats.com's Industrial Production Index after Inflation
Shadowstats.com - Industrial Production Index after Inflation
Still, many would argue that we are not an industrial nation. That our GDP's strength lies on the incredible American consumer. Here, I raise the bull-sh&#t card once again.
Understanding why the American consumer is not what the media would lead us to believe isn't hard. It just takes a little business insight.
Any business person knows how to price their products. Keystone-markup, for example, is a well known term among professionals. Well, anyone with a pen, a napkin and half a sense on how to price goods will intuitively understand that, if factories and retailers get their typical markups, the consumer will account for about 60% of all the translations taking place.
When the government calculates GDP, they take all sales by every entity in the economy and reduce them by the value of imports. So a factory in the US pays about $15.75 for labor and raw materials. A retailer pays about $45.00 for the factory's gizmo after it is delivered to its doors. Finally, a consumer pays $100 in retail value for the same gizmo. Even under this simplistic scenario, an average consumer will be 62% of the total GDP. Now that if the country is a heavy exporter, an average consumer will become a higher percentage of the GDP. If, on the other hand, the country is a large exporter, then the opposite happens; the consumer's portion of GDP goes down.
List of global Household's final consumption expenditures as a percentage of GDP
The very average US consumer 
Let's take a look at the portion of consumers around the world and their share of their national GDP. I invite you to browse the list to the right.
American consumers are clearly not exceptional. Instead, they are average at best. The US consumer is right at the middle of the group. Now that if we still insist in arguing that our consumer is somehow very strong as a way to explain its large portion of GDP, then how do we explain Guatemalan consumers, who are in fact a larger portion of the Guatemala's GDP? Do American consumers aspire to be like Guatemalans?
It simply doesn't make sense. We are not a consumer based nation. If anything, all nations are consumer based. As long as manufacturers don't pay more for their inputs than consumers pay for final goods, the same scenario will prevail. I think it is safe to assume that the consumer's portion of GDP is to remain within a narrow range until the earth cools.
As I have shown in many previous instances, our elected leaders are economically handicapped. They themselves do not understand even the simplest of economic principles. Moreover, they are apathetic to the smallest of financial research. Yes, they don't know business and don't want to learn. It is no wonder that they are currently pushing thousands of businesses into the abyss.
At the end of the day, our economy will continue to depend on industrial activity as the place where every good renaissance starts. God have mercy on us!

Friday, March 13, 2015

Artificial or Else - Questionable US Recovery

They claim the recovery is solid. Just look at the stock market, they say.
picture of CNBC's Senior Economics Reporter Steve Liesman
CNBC's Steve Liesman
Economists like CNBC's Steve Liesman and investment peddlers everywhere insist that the seemingly unstoppable stock market climb is a sign that all is rosy within the US economy. After all, they say, isn't the stock market a price-discovery mechanism intended to value all information about the economy instantaneously?
Well, yes and no. The stock market, like any other market, acts as a pricing tool. Where things go bad is that it is now being distorted by the massive gravitational presence of the Federal Reserve's balance sheet. Never before in history did a single entity monetization so much. Never before did markets have to deal with such a large distortion. Let's take a close look at a sector that I feel disproves their allegations.
image of chart from Saint Louis, MO Federal Reserve showing a decline in Retail Sales at Department Stores compared to an increasing US population
Department Store Sales collapse.
Meanwhile, the buying population increases.
Visiting the Federal Reserve's own website, one can easily see that retail sales at department stores across the nation have collapsed. Things are so bad that I will suggest you take pictures of all the anchor stores next time you visit the mall. In no time, your images of formerly well known dinosaurs will appreciate in value.
But not all is bad of course. Noise is never so simple to clean. The fact remains that a continuously growing US population has made the size of the buying market larger; thus helping grow total US retail sales. Yet, all benefits from such market growth seem to have completely missed department stores across the nation. Just look at the Fed's chart above; department store revenue has fallen to scary levels. As a result, there's even talk about how these players are failing to entice new buyers as they continue to lose old ones.
But don't say I didn't warn you. While my forecast for the beginning of 2015 was a little lower than where things are now, I had told you in my article back in July, 2013 that Department Store sales would continue to plummet. Well, they did.
stock price chart comparison of Dillard's, Macy's and Nordstrom.
Stock valuations of Dillard's, Macy's and Nordstrom
continue to push higher despite horrible retail performance
Surprisingly, though, none of these terrible facts is reflected in their stock valuations. As things have turned worse, stock prices of companies like Macy's, Dillard's and Nordstrom continue to increase; just as if revenue performance was stellar.
So, how is this possible? Isn't bad sales data supposed to push stock prices lower?
While we all know that the stock market can behave irrationally in the short term, we still trust that long term price performance correlates with fundamental health. But as it should now be clear, we are witnessing an anomaly.The expected poor stock price is conspicuously missing. Current valuations rather reflect boom times.
Thanks to the disruptive effect of the Federal Reserve's Balance Sheet, department stores are being rewarded for carrying a poor business model that sports an upcoming expiration date.
The Fed's massive money printing has created the ideal environment for capital misallocation. So the story repeats: excess money is put in the wrong hands and... boom, a bubble pops. Let's hope that shrapnel doesn't hurt innocent people this time around.
If you still believe that the market is really serving as proof of a healthy US economy, don't worry; I have a couple of other posts that will destroy your thesis. Until then, enjoy the volatility.

Wednesday, December 18, 2013

Great MIT Research - Free Access for a Limited Time

logo of MIT Sloan Executive Education
MIT Sloan
MIT is giving free access to a few of their incredibly valuable research papers to MIT Sloan Executives. It goes without saying that I feel that MIT is the absolute best school in the world. MIT researchers are the only ones that balance the art of business with the rigidity of data. I loved my marketing class because of this exact thing. As a result, their research is essential for all managers, from the middle to the top.
Make note of the fact that the availability is for a limited time. So hurry.
Below are the papers available. Otherwise follow the general link.


Articles by Deborah Ancona
Deborah Ancona is Professor of Organization Studies at MIT Sloan and Faculty Director of the MIT Leadership Center. She teaches in Transforming Your Leadership Strategy and the Advanced Management Program (AMP).
The Comparative Advantage of X-Teams

Articles by Erik Brynjolfsson
Erik Brynjolfsson is Professor of Information Technology and Director of The MIT Center for Digital Business. He teaches in Big Data 4Dx (online); Big Data: Making Complex Things Simpler; and Future of Manufacturing.
Winning the Race With Ever-Smarter Machines
Competing in the Age of Omnichannel Retailing
What the GDP Gets Wrong (Why Managers Should Care)

Articles by Steven Eppinger
Steven Eppinger is Professor of Management Science and Engineering Systems and Co-Director of the System Design and Management Program. He teaches in Managing Complex Technical Projectsand Systematic Innovation of Products, Processes, and Services.
How Sustainability Fuels Design Innovation

Articles by Tom Kochan
Tom Kochan is Professor of Work and Employment Research and Engineering Systems and Co-Director of MIT Sloan Institute for Work and Employment Research. He teaches in Strategies for Sustainable Business.
The Management Lessons of a Beleaguered Industry
Taking the High Road
MIT Executive MBA

Articles by Donald Lessard
Donald Lessard is Professor of Global Economics and Management and Professor of Engineering Systems. He teaches in Strategy in a Global World.
Building Your Company’s Capabilities Through Global Expansion

Articles by Fiona Murray
Fiona Murray is Associate Dean for Innovation. She is also Faculty Director of the Martin Trust Center for MIT Entrepreneurship. She teaches in the Entrepreneurship Development Program and the MIT Regional Entrepreneurship Acceleration Program (REAP).
Spurring Innovation Through Competitions

Articles by Alex Pentland
Alex ‘Sandy’ Pentland is the Toshiba Professor of Media Arts and Sciences, Director of Human Dynamics Lab, and Director of the MIT Media Lab Entrepreneurship Program. He teaches in Big Data 4Dx (online); Big Data: Making Complex Things Simpler; and Leading Change in Complex Organizations.
Understanding ‘Honest Signals’ in Business
Can High-Frequency Trading Drive the Stock Market Off a Cliff?

Articles by Douglas Ready
Douglas Ready is Senior Lecturer in Organization Effectiveness. He teaches in the new program,Building Game-Changing Organizations: Aligning Purpose, Performance, and People.
Enabling Bold Visions
Leading at the Enterprise Level
Why Leadership-Development Efforts Fail

Articles by Jeanne Ross
Jeanne Ross is Director and Principal Research Scientist at MIT Sloan’s Center for Information Systems Research (CISR). She teaches in Essential IT for Non-IT Executives and Revitalizing Your Digital Business Model.
Finding Value in the Information Explosion

Articles by José Santos
José F.P. dos Santos is Visiting Professor at MIT Sloan and Professor at INSEAD, Fontainebleau, France. He teaches in Strategy in a Global World.
Is Your Innovation Process Global?

Articles by Peter Senge
Peter Senge is Senior Lecturer in Leadership and Sustainability at MIT Sloan.
Collaborating for Systemic Change
Innovating Our Way to the Next Industrial Revolution

Articles by/featuring David Simchi-Levi
David Simchi-Levi is Professor of Engineering Systems at MIT. He teaches in Future of Manufacturing and Supply Chain Strategy and Management.
Is It Time to Rethink Your Manufacturing Strategy?
Your Next Supply Chain
When One Size Does Not Fit All

Articles by John Sterman
John Sterman is Professor of System Dynamics and Engineering Systems and Director of the MIT System Dynamics Group. He teaches in Business Dynamics: MIT's Approach to Diagnosing and Solving Complex Business Problems; Leading Change in Complex Organizations; Strategies for Sustainable Business; and Understanding and Solving Complex Business Problems.
What the Future May Bring

Articles by Scott Stern
Scott Stern is the School of Management Distinguished Professor and Chair of the Technological Innovation, Entrepreneurship, and Strategic Management Group at MIT Sloan. He teaches in theMIT Regional Entrepreneurship Acceleration Program (REAP).
Innovation: Location Matters

How Companies Can Avoid a
Midlife Crisis by Donald Sull
Articles by/featuring Donald Sull
Donald Sull is Senior Lecturer at MIT Sloan. He teaches in the new program, Building Game-Changing Organizations: Aligning Purpose, Performance, and People.
How Companies Can Avoid a Midlife Crisis
Closing the Gap Between Strategy and Execution
Using Commitments to Manage Across Units

Articles by Catherine Tucker
Catherine Tucker is the Mark Hyman Jr. Career Development Professor and Associate Professor of Marketing at MIT Sloan. She teaches in the Global Executive Academy; Strategic Marketing for the Technical Executive; Systematic Innovation of Products, Processes, and Services; and theEntrepreneurship Development Program.
Why Managing Consumer Privacy Can Be an Opportunity

Articles by/featuring Eric von Hippel
Eric von Hippel is Professor of Management of Innovation and Engineering Systems and the founder of the Entrepreneurship Program at MIT. He teaches in Building, Leading, and Sustaining the Innovative Organization and the Global Executive Academy.
The User Innovation Revolution
The Age of the Consumer-Innovator
Innovation by User Communities: Learning From Open-Source Software
Innovation Process Benefits: The Journey as Reward
The Benefits of Combining
Data With Empathy

Articles by Peter Weill
Peter Weill is Chairman of the Center for Information Systems Research (CISR) and MIT Sloan Senior Research Scientist. He teaches in Essential IT for Non-IT Executives and Revitalizing your Digital Business Model.
The Benefits of Combining Data With Empathy
The Business Models Investors Prefer

Articles by Peter Weill & Stephanie Woerner
Stephanie Woerner is Research Scientist at the MIT Sloan Center for Information Systems Research. She teaches in Revitalizing your Digital Business Model.
Optimizing Your Digital Business Model

Articles by Ezra Zuckerman
Ezra Zuckerman is Professor of Technological Innovation, Entrepreneurship, and Strategic Management and Chair of the MIT Sloan PhD Program. He teaches in Developing and Managing a Successful Technology and Product Strategy and the Advanced Management Program (AMP).
Improving Capabilities Through Industry Peer Networks

Tuesday, November 12, 2013

China Pushes U.S. Out of the Way

First Car Sales, Now China's Online Sales Break All Records During Single's Day. 

Do you look at the relentless marketing efforts behind Valentine's Day with suspicion? I do. But no matter what we think, we are still obligated to spend money on our significant-other every year or else risk being placed in the dog house.
Colorful Image of a banner ad for the Cinco de Mayo celebrations with two Corona beers in between the Corona logo
Cinco de Mayo Celebration
Then, how about the fact that Cinco de Mayo celebrates a scrimmage between the Mexican and French armies of no more relevance than the battle of El Alamo? Yet, Cinco de Mayo is now marketed as Independence Day and a great opportunity to consume Corona, the Mexican beer.
But have you heard about Single's Day? I guess that in the absence of a "Couple's Day", also known as Valentine's Day here in the US, the Chinese have opted for a more appropriate form of celebrating consumption. It is all about loving thyself and showing it with a purchase of say sneakers.
This last November 11, the Chinese celebrated Single's Day by shattering all online sales records for a single day. To put this in perspective, by midday sales had already doubled the highest Cyber Monday record from the US. Yes, our best attempt at consuming stuff online, Cyber Monday, was no match for this year's flock of single Chinese looking to show themselves some love.
For those unsure about what Cyber Monday is, simply look at it as the Monday after Black Friday when shoppers go online rather than the stores to buy Christmas presents.
As if this was not impressive enough, consider the fact that China hovers closely behind the US on yearly online sales. This creates a feeling of having to constantly look at the rear-view mirror, which is reminiscent of 2009 when the US finally gave up the lead in new car sales to the eastern powerhouse.
Aerial photo of a traffic jam on a roundabout in a Chinese city
China Leads in Car Sales
So what's next? We are no longer the same fat cats who showed the Mini Cooper driving Europeans what the pleasure of rushing through the open road without limitations was like. Now, the Chinese are the leaders. While they have chosen to mostly create traffic jams rather than to hit US Route 66, they are consuming more cars than even the mighty US.
Now, we are also close to no longer being kings of shopping. Within a year, we will lose the online crown. Soon after, we shall give up our lead on total retail sales. But for the latter, we still have a few months to enjoy the top.
The Chinese call themselves communists but behave more like capitalists than the Obama administration or the state of California. This has truly been an incredible performance by a country with lots of upside left since there are millions in China who still live under the poverty level. Over the next few decades, China will continue to gain at every metric. The US on the other hand, will probably have to sit watching from the sidelines as our baby boomers reduce their economic footprint. Keep an eye on the events and remain aware that this is a historic moment.


Tuesday, July 16, 2013

How Much Do You Buy? - US Retail Sales Report

Photo of six shopping bags on the floor and surrouding the legs of a lady shopper on hills
What do you do? 
This is the questions that's most commonly asked in the US to define an individual we just met. We seem to believe that a person's profession tells us who someone is. But while this may work from a social perspective, to understand a person's impact on the economy the right question should be: How much do you buy?
The US consumer is the envy of many nations. China, for one, would like to own many of them. But governments aren't the only ones with power-shopping in mind.
Visiting foreigners rush to outlet malls and premium retailers as soon as they land. When my mother-in-law visits us from south America, the local Chico's celebrates. They exclusively open the store after hours for her. She is then allowed to shop at her leisure and with a personal assistant. Would you believe me if I told you that she is not wealthy? She just loves shopping in the US.
In a very important way, shoppers define the economy. When consumers change buying habits, industries surge while others fail. This is the reason why every retailer has an eye on whatever Baby Boomers will do next. Boomers have made brands like Harley Davidson believe that they were "really good" at selling stuff. Honda thought the same with their street rockets during the late 70's and early 80's; that was at least until Boomers got married and stopped buying their motorcycles cold turkey. Hundreds of Honda dealerships closed. We will see what happens to Harley Davidson after aging lawyers discover that they won't be able to walk for days after ridding their hog for a couple of hours. It's incredible how small things like these impact the macro-picture.

Cyber-Push - Online Stores
Data Graph of Online Sales' Market Share of total sales and Year over Year Market Share Change in the US as of June 2013
e-tailers Market Share
and YoY Share Growth
If you ask a local brick and mortar retailer, they will probably tell you that online retailers have stolen a large portion of their sales; perhaps upwards of 45%. Because more consumers have adopted showrooming, retailers face the challenge of constantly having to defend their pricing decisions to a growing number of customers. In fact, it wouldn't surprise me if more than 45% of customers use online pricing as a way to put pressure on local retailers.
In contrast, the evidence shows that online retailers account for a much smaller share of total sales than brick and mortar retailers estimate.
As of today, the total market share for online sales resides right below 9%. This number is a vast improvement when compared to the close to 5% from the end of 2001.
Data Graph of Retail Sales for Nonstore (online) Retailers from January 2000 to June 2013
Retail Sales
January 2000 - June 2013
Nonstore Retailers
It is important to note that the late Peter Drucker doubted that online sales' would exceed the peak market-share of less than 28% by mail-order businesses.
Even if this prescribed maximum range proves to be a robust glass ceiling, there is still plenty of growth ahead for online retailers.
The updated sales chart for Nonstore (online) Retailers shows that, besides a clear and continuous rise, sales are actually accelerating. The old trend channel has now been left behind in favor of the new upper channel. If category growth continues, which it certainly looks like it could, more overhead channel breaks are possible. This means that a reversion to the bottom channel is highly improbable in the near future. Momentum is simple too strong; especially when compared to all other retail categories. 

The Lesser Side of Change - Department Stores
Data Graph of Retail Sales for Department Stores (Excluding Leased Departments) from January 2000 to June 2013
Retail Sales
January 2000 - June 2013
Department Stores (Excluding Leased Departments)
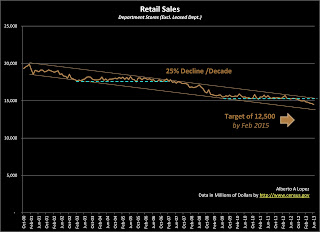
While online retailers continue their push higher, Department Stores have recently confirmed a new leg down within their negatively sloped trend. Since the turn of the millennium, more than 25% of their revenues have evaporated. That this is happening while population continues to grow highlights their terrible predicament. Boomers are slowing their support while younger shoppers are not coming on board. 
It seems as if the decline has not been kind with all retailers equally. Some, like Macy's have fared much better than others, like JC Penney
If the downward trend continues, it will be important to recognize that even the best management teams in the industry will struggle to keep their company growing. Great markets make bad managers look great while bad markets make great managers look bad. 
While nothing moves in a straight line, I feel that a reasonable target would be for total category sales to fall to near $12,500 million by February of 2015. Again, not a pretty picture.

Pent Up Expectations - Motor Vehicle Dealers
Data Graph of Retail Sales for Motor Vehicle and Parts Dealers from January 2000 to June 2013
Retail Sales
January 2000 - June 2013
Motor Vehicle and Parts Dealers
The nation is abuzz with the idea that automotive sales have rebounded. After all, who doesn't want Detroit, a symbol of our industrial might, to come back from its near death experience.
Fortunately, Motor Vehicle sales growth has built enough momentum now that it's trying to break above the Employee Pricing Program peak of 2005. Much of the push is probably due to the pent up demand accumulated during the past few years.
Unfortunately, a portion of the stored demand will be inevitably lost. This is because pent up demand has an expiration date. When a consumer skips two years to replace an aging car, she will not necessarily buy a vehicle two years ahead of schedule in the future to compensate. As a result, I feel that the chart to the right will not revert to its long term trend; which shows too large of a gap, even for any strong gains arising from further population growth. Moreover, there is a high possibility that we may experience a near-term correction in the trend as exponential-looking charts like this one are unsustainable.

What Inflation? - Gasoline Stations
Data Graph of Retail Sales for Gasoline Stations from January 2000 to June 2013
Retail Sales
January 2000 - June 2013
Gasoline Stations
Despite an unwavering commitment by our government to argue that inflation is nonexistent, Gas Station sales seem to paint a different picture.
As it's common with strong trending markets, the recent temporary boom and bust periods did not break the long term trend.
This trend should persist. Global inflationary pressure on energy costs and refinery bandwidth should continue for a few more decades while new middle classes are formed all around the world.
The chart shows that sales have just reached their 2008 peak. The coil formation shows that this is a pivotal point. When these coils form, charts usually move violently in either upward or downward direction. The fact that sales are now touching the bottom of the long term trend channel suggests to me that the coiling process is near its end. If this observation is correct, then sales could break either way any moment now.
Since energy consumption will continue to expand globally, even through slow economic stages, I expect energy prices to increase in the near future. This would drive Gasoline revenues higher. As a result, my bet is that the pivotal point that we are witnessing will resolve with a strong push upward, even if our national economy was to slow down. Hang on to your wallets.

Boom Anew? - Building Materials, Garden and Furniture
Data Graph of Retail Sales for Building Materials, Garden Equipment and Supply Dealers from January 2000 to June 2013
Retail Sales
January 2000 - June 2013
Building Materials, Garden Equipment & Supply Dealers
Despite evidence that housing continues to recover; I am skeptical that real estate investors like BlackRock will display the endurance needed for true long-term home-price sustainability.
Not withstanding any concerns I may have, retail sales at Building Materials, Garden Equipment and Supply Dealers have continued their recovery. Not quite past the 2008 peak, the chart shows its strong regression-to-the-mean tendency. Sales are close to the long term trend.
There are many reasons why these retailers should continue to rise despite a flat housing market. Home refurbishing could be as much of a driver as new home decoration, for example. At least for now, I feel comfortable assuming that sales at these retailers will continue to grow. If anything, I may keep an eye on the slope of the rising chart. I would not be surprised if growth was to decelerate in the event of lesser total US economic growth.
Data Graph of Retail Sales for Furniture and Home Furnishing Stores from January 2000 to June 2013
Retail Sales
January 2000 - June 2013
Furniture and Home Furnishing Stores
Also not surprising is the fact that Furniture and Home Furnishing stores are at approximately the same stage in their recovery. Both, after all, are levered to housing. The only note here is that it seems as if Furniture Stores will face a greater challenge than Building Material Stores trying to retake the long term channel.
It will be worth watching inventory levels and financial leverage of any retailers within these two categories. Those with the highest exposure to risk may fail in a continuously struggling environment. This is also a time when increased operational efficiency will result in improved market positioning.


Youthful Cheer - Sporting Goods, Hobby, Books and Music Stores
Data Graph of Retail Sales for Sporting Goods, Hobby, Books and Music Stores from January 2000 to June 2013
Retail Sales
January 2000 - June 2013
Sporting Goods, Hobby, Books and Music Stores
Sporting Goods, Hobby, Books and Music Stores are well within their long term trend. This category has proven to be quite resilient through the tough times; an indication that young shoppers have successfully taken the driver's seat from their Boomer parents.
Recently, the pre-recession top was confidently cleared. Growth will probably continue at the present measured rate. I just don't see a reason why growth should accelerate.
Now that innovation could completely change the picture. Let's keep an eye of these retailers to see if they surprise us


Old Faithful  - Grocery, Food and Beverages
Data Graph of Retail Sales for Grocery Stores from January 2000 to June 2013
Retail Sales
January 2000 - June 2013
Grocery Stores
At Yellowstone National Park, there is a famous geyser. Old Faithful never fails to deliver its gushes of steam and water, no matter the time of the year or the weather.
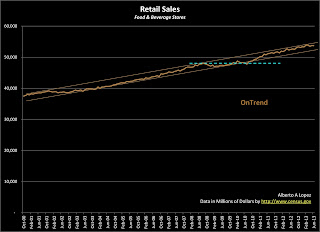
Likewise, there are those retailers that seem to always create positive cash flows during good and bad economic times. Grocery Stores, Food Stores, Beverage Stores, Food Services and Drinking Places are always reliable. They have in common that they serve a most basic human need: nourishment.
The three charts shown here display well controlled increases in sales over the long term. The trend channels are indeed smooth and tight. When it comes to Food and Beverage stores, not much changes over time; even during extreme boom and bust cycle gyrations. Looking at the three charts, it is difficult to discern any negative effects due to the global financial crisis. At most, sales flattened for a few months before continuing growth again.
Data Graph of Retail Sales for Food and Beverage Stores from January 2000 to June 2013
Retail Sales
January 2000 - June 2013
Food and Beverage Stores
Also a sign of their tendency to perform, the 2008 pre-recessionary peak was easily surpassed by mid 2010 in all three charts.
A lot of discussions have taken place about the fact that during the recession many consumers stopped eating at mid to premium restaurants in favor of cheaper alternatives. While this may be the case at some level, the last chart (Food Services and Drinking Places) shows that overall sales did not change much. Maybe consumers changed from say a Chilli's to a Burger King; but the size of the bills did not change much based on what the chart shows. This, by the way, is not unusual when looking at large data samples. While many shifts at the micro level create quite a bit of noise, the macro picture has a mechanism that cancels out such noises.
Data Graph of Retail Sales for Food Services and Drinking Places from January 2000 to June 2013
Retail Sales
January 2000 - June 2013
Food Services and Drinking Places
As long as population continues to expand, I see no reason for any changes in behavior in these category charts.
The forecast is that we will see smooth growth for a few more years. Even if the economy was to slow down, Food sellers would at worse see a flattening in sales for a few months. Growth would return soon after.


Teenage Lifestyle - Clothing and Clothing Accessories Stores
Data Graph of Retail Sales for Clothing and Clothing Accessories Stores from January 2000 to June 2013
Retail Sales
January 2000 - June 2013
Clothing and Clothing Accessories Stores
There are many expenditures that parents can curve when trying to stay on a budget. Nonetheless, nothing is as hard for them as to say no to a relentless teenager who periodically hijacks their emotions with threats of clinical depression for not having the latest pair of jeans that "the other kids in school" wear. Yes, teenagers know how to play the spending game.
Clothing retailers also know how to press those bright and cheerful buttons. As a result, the Clothing and Clothing Accessories Stores category shows no sign of anything but continuous growth. The recession brought a slowdown in sales; something that by now is simply part of history. The category broke past the 2008 top with plenty of conviction. If anything, maybe the chart shows that we are close to a short term top that may be followed by temporary flattening or even a small pull back in sales. This would only happen if the US economy was to go into another recession. But from the demographic perspective, there is nothing on the horizon that could adversely affect this category.

Deflation Du jour  - Electronics and Appliances Stores
Data Graph of Retail Sales for Electronics and Appliance Stores from January 2000 to June 2013
Retail Sales
January 2000 - June 2013
Electronics and Appliance Stores
The electronics industry is perhaps the best supporting example of the belief that says that aggressive market competition is great for consumers, who are left with all the gains, while being terrible in the long term for the businesses that compete.
As technologies evolve, more complex manufacturing processes are compressed into tinier development times. This means that lagging competing products of good enough quality arrive to markets soon after those from the most innovating companies. Besides driving revenues lower, deflationary pressures are exerted much sooner than at any other time in history.
Then add the fact that online retailers have brought improved operational efficiency and pricing transparency to the market and you have a compounded deflationary effect. 
As a result, a store that sells the same quantity of units year-over-year will see a substantial reduction in sales and margins. In electronics, the only way to keep the head above water is by moving more boxes every single day. But even moving more boxes is challenging as the gross margin base shrinks due to deflationary pressures. There is just no money left to hire the additional people needed to handle the extra transactions. Do you now wonder why is it that places like Best Buy have fallen out of favor with Wall Street analysts? It is simply tough business. 
The updated sales chart shown here highlights the sensitivity that this category has to the economic environment. Its Beta is high. As the economy boomed, electronic sales grew past the long term trend. Now that we are experiencing an almost nonexistent recovery, sales volumes are diverging from the trend. This divergence may reflect the fact that Baby Boomers are now leaving the Electronics party in favor of other categories. This divergence also helps us anticipate an extended period of flat performance. At worst, a decline in sales could materialize; something that I am not sure will happens as long a the US population continues to expand. I guess that if we were to fall back into another recession, sales would go down for a period before flattening soon after.
At any rate, neither the picture nor the forecast are great. Keep an eye on this important category.

Finally Bending - Health and Personal Care Stores
Data Graph of Retail Sales for Health and Personal Care Stores from January 2000 to June 2013
Retail Sales
January 2000 - June 2013

Health and Personal Care Stores
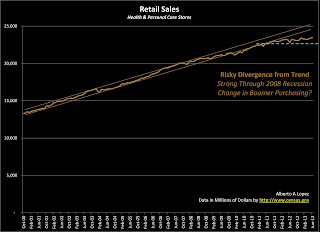
Take a look at all the charts. Even the best performers like Online and Food Retailers display a recessionary elbow as part of the curve during 2008. Now look at this chart of the Personal Care category. It could be argued that there is no elbow. My feeling is that females of the Baby Boomer generation might have compromised on everything they bought for the family during the recession; everything that is but their cosmetics. If there was ever a generation of well pampered residents, theirs would be it.
But now, after risk has supposedly subsided, the chart has broken out of its long term trend. The diverging gap is in fact growing. In my opinion, this tells a very dark story about the near to mid term future for these retailers. We are at least 10 years away from seeing the children of these Boomer moms start buying the same Personal Care products and services. In fact, it is my experience that when they do come on board as clients, the younger generation will not buy the same products or shop at the same stores. I would therefore watch for innovators withing the category and stay away from any retailer that can't cover its cost of capital. For about a decade now, things may get very tough.

Hurray for US Shoppers 
 In general, retail sales have demonstrated that American consumers continue to be the most reliable economic force in the global economy. While China slows down trying to control a renegade real estate market and Europe comes to the realization that incomes must be matched by productivity, the US remains the best and most desirable market in the world. People all over the planet are willing to buy our securities at ridiculous prices despite fiscal irresponsibility and political dysfunction. I believe that, at the end of the day, there are two great reasons that make all of it happen; and both are tied to American people.
Our companies are more innovative because our people. Our Retailers have experienced resilient sales thanks also to our people. Whether as a shopper or as an innovator, each American person has bought our incompetent government more time to try to get us back on track. Hurray for US Shoppers.