What do you do?
This is the questions that's most commonly asked in the US to define an individual we just met. We seem to believe that a person's profession tells us who someone is. But while this may work from a social perspective, to understand a person's impact on the economy the right question should be: How much do you buy?
The US consumer is the envy of many nations. China, for one, would like to own many of them. But governments aren't the only ones with power-shopping in mind. This is the questions that's most commonly asked in the US to define an individual we just met. We seem to believe that a person's profession tells us who someone is. But while this may work from a social perspective, to understand a person's impact on the economy the right question should be: How much do you buy?
Visiting foreigners rush to outlet malls and premium retailers as soon as they land. When my mother-in-law visits us from south America, the local Chico's celebrates. They exclusively open the store after hours for her. She is then allowed to shop at her leisure and with a personal assistant. Would you believe me if I told you that she is not wealthy? She just loves shopping in the US.
In a very important way, shoppers define the economy. When consumers change buying habits, industries surge while others fail. This is the reason why every retailer has an eye on whatever Baby Boomers will do next. Boomers have made brands like Harley Davidson believe that they were "really good" at selling stuff. Honda thought the same with their street rockets during the late 70's and early 80's; that was at least until Boomers got married and stopped buying their motorcycles cold turkey. Hundreds of Honda dealerships closed. We will see what happens to Harley Davidson after aging lawyers discover that they won't be able to walk for days after ridding their hog for a couple of hours. It's incredible how small things like these impact the macro-picture.
Cyber-Push - Online Stores
 |
| e-tailers Market Share and YoY Share Growth |
In contrast, the evidence shows that online retailers account for a much smaller share of total sales than brick and mortar retailers estimate.
As of today, the total market share for online sales resides right below 9%. This number is a vast improvement when compared to the close to 5% from the end of 2001.
 |
Retail Sales
January 2000 - June 2013
Nonstore Retailers
|
Even if this prescribed maximum range proves to be a robust glass ceiling, there is still plenty of growth ahead for online retailers.
The updated sales chart for Nonstore (online) Retailers shows that, besides a clear and continuous rise, sales are actually accelerating. The old trend channel has now been left behind in favor of the new upper channel. If category growth continues, which it certainly looks like it could, more overhead channel breaks are possible. This means that a reversion to the bottom channel is highly improbable in the near future. Momentum is simple too strong; especially when compared to all other retail categories.
The Lesser Side of Change - Department Stores
 |
Retail Sales
January 2000 - June 2013
Department Stores (Excluding Leased Departments)
|
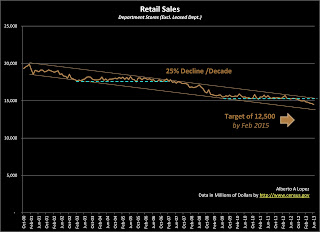
It seems as if the decline has not been kind with all retailers equally. Some, like Macy's have fared much better than others, like JC Penney.
If the downward trend continues, it will be important to recognize that even the best management teams in the industry will struggle to keep their company growing. Great markets make bad managers look great while bad markets make great managers look bad.
While nothing moves in a straight line, I feel that a reasonable target would be for total category sales to fall to near $12,500 million by February of 2015. Again, not a pretty picture.
 |
Retail Sales
January 2000 - June 2013
Motor Vehicle and Parts Dealers
|
Fortunately, Motor Vehicle sales growth has built enough momentum now that it's trying to break above the Employee Pricing Program peak of 2005. Much of the push is probably due to the pent up demand accumulated during the past few years.
Unfortunately, a portion of the stored demand will be inevitably lost. This is because pent up demand has an expiration date. When a consumer skips two years to replace an aging car, she will not necessarily buy a vehicle two years ahead of schedule in the future to compensate. As a result, I feel that the chart to the right will not revert to its long term trend; which shows too large of a gap, even for any strong gains arising from further population growth. Moreover, there is a high possibility that we may experience a near-term correction in the trend as exponential-looking charts like this one are unsustainable.
What Inflation? - Gasoline Stations
 |
Retail Sales
January 2000 - June 2013Gasoline Stations |
As it's common with strong trending markets, the recent temporary boom and bust periods did not break the long term trend.
This trend should persist. Global inflationary pressure on energy costs and refinery bandwidth should continue for a few more decades while new middle classes are formed all around the world.
The chart shows that sales have just reached their 2008 peak. The coil formation shows that this is a pivotal point. When these coils form, charts usually move violently in either upward or downward direction. The fact that sales are now touching the bottom of the long term trend channel suggests to me that the coiling process is near its end. If this observation is correct, then sales could break either way any moment now.
Since energy consumption will continue to expand globally, even through slow economic stages, I expect energy prices to increase in the near future. This would drive Gasoline revenues higher. As a result, my bet is that the pivotal point that we are witnessing will resolve with a strong push upward, even if our national economy was to slow down. Hang on to your wallets.
Boom Anew? - Building Materials, Garden and Furniture
 |
Retail Sales
January 2000 - June 2013
Building Materials, Garden Equipment & Supply Dealers
|
Not withstanding any concerns I may have, retail sales at Building Materials, Garden Equipment and Supply Dealers have continued their recovery. Not quite past the 2008 peak, the chart shows its strong regression-to-the-mean tendency. Sales are close to the long term trend.
There are many reasons why these retailers should continue to rise despite a flat housing market. Home refurbishing could be as much of a driver as new home decoration, for example. At least for now, I feel comfortable assuming that sales at these retailers will continue to grow. If anything, I may keep an eye on the slope of the rising chart. I would not be surprised if growth was to decelerate in the event of lesser total US economic growth.
 |
Retail Sales
January 2000 - June 2013Furniture and Home Furnishing Stores |
It will be worth watching inventory levels and financial leverage of any retailers within these two categories. Those with the highest exposure to risk may fail in a continuously struggling environment. This is also a time when increased operational efficiency will result in improved market positioning.
Youthful Cheer - Sporting Goods, Hobby, Books and Music Stores
 |
Retail Sales
January 2000 - June 2013Sporting Goods, Hobby, Books and Music Stores |
Recently, the pre-recession top was confidently cleared. Growth will probably continue at the present measured rate. I just don't see a reason why growth should accelerate.
Now that innovation could completely change the picture. Let's keep an eye of these retailers to see if they surprise us
Old Faithful - Grocery, Food and Beverages
 |
Retail Sales
January 2000 - June 2013
Grocery Stores |
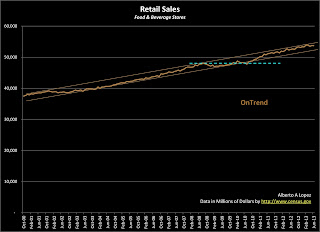
Likewise, there are those retailers that seem to always create positive cash flows during good and bad economic times. Grocery Stores, Food Stores, Beverage Stores, Food Services and Drinking Places are always reliable. They have in common that they serve a most basic human need: nourishment.
The three charts shown here display well controlled increases in sales over the long term. The trend channels are indeed smooth and tight. When it comes to Food and Beverage stores, not much changes over time; even during extreme boom and bust cycle gyrations. Looking at the three charts, it is difficult to discern any negative effects due to the global financial crisis. At most, sales flattened for a few months before continuing growth again.
 |
Retail Sales
January 2000 - June 2013Food and Beverage Stores |
A lot of discussions have taken place about the fact that during the recession many consumers stopped eating at mid to premium restaurants in favor of cheaper alternatives. While this may be the case at some level, the last chart (Food Services and Drinking Places) shows that overall sales did not change much. Maybe consumers changed from say a Chilli's to a Burger King; but the size of the bills did not change much based on what the chart shows. This, by the way, is not unusual when looking at large data samples. While many shifts at the micro level create quite a bit of noise, the macro picture has a mechanism that cancels out such noises.
 |
Retail Sales
January 2000 - June 2013
|
The forecast is that we will see smooth growth for a few more years. Even if the economy was to slow down, Food sellers would at worse see a flattening in sales for a few months. Growth would return soon after.
Teenage Lifestyle - Clothing and Clothing Accessories Stores
 |
Retail Sales
January 2000 - June 2013Clothing and Clothing Accessories Stores |
Clothing retailers also know how to press those bright and cheerful buttons. As a result, the Clothing and Clothing Accessories Stores category shows no sign of anything but continuous growth. The recession brought a slowdown in sales; something that by now is simply part of history. The category broke past the 2008 top with plenty of conviction. If anything, maybe the chart shows that we are close to a short term top that may be followed by temporary flattening or even a small pull back in sales. This would only happen if the US economy was to go into another recession. But from the demographic perspective, there is nothing on the horizon that could adversely affect this category.
Deflation Du jour - Electronics and Appliances Stores
 |
Retail Sales
January 2000 - June 2013Electronics and Appliance Stores |
As technologies evolve, more complex manufacturing processes are compressed into tinier development times. This means that lagging competing products of good enough quality arrive to markets soon after those from the most innovating companies. Besides driving revenues lower, deflationary pressures are exerted much sooner than at any other time in history.
Then add the fact that online retailers have brought improved operational efficiency and pricing transparency to the market and you have a compounded deflationary effect.
As a result, a store that sells the same quantity of units year-over-year will see a substantial reduction in sales and margins. In electronics, the only way to keep the head above water is by moving more boxes every single day. But even moving more boxes is challenging as the gross margin base shrinks due to deflationary pressures. There is just no money left to hire the additional people needed to handle the extra transactions. Do you now wonder why is it that places like Best Buy have fallen out of favor with Wall Street analysts? It is simply tough business.
The updated sales chart shown here highlights the sensitivity that this category has to the economic environment. Its Beta is high. As the economy boomed, electronic sales grew past the long term trend. Now that we are experiencing an almost nonexistent recovery, sales volumes are diverging from the trend. This divergence may reflect the fact that Baby Boomers are now leaving the Electronics party in favor of other categories. This divergence also helps us anticipate an extended period of flat performance. At worst, a decline in sales could materialize; something that I am not sure will happens as long a the US population continues to expand. I guess that if we were to fall back into another recession, sales would go down for a period before flattening soon after.
At any rate, neither the picture nor the forecast are great. Keep an eye on this important category.
 |
| Retail Sales January 2000 - June 2013 Health and Personal Care Stores |
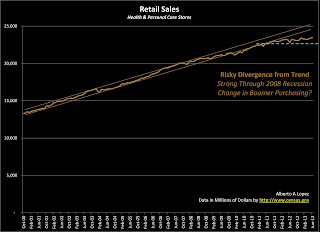
But now, after risk has supposedly subsided, the chart has broken out of its long term trend. The diverging gap is in fact growing. In my opinion, this tells a very dark story about the near to mid term future for these retailers. We are at least 10 years away from seeing the children of these Boomer moms start buying the same Personal Care products and services. In fact, it is my experience that when they do come on board as clients, the younger generation will not buy the same products or shop at the same stores. I would therefore watch for innovators withing the category and stay away from any retailer that can't cover its cost of capital. For about a decade now, things may get very tough.
In general, retail sales have demonstrated that American consumers continue to be the most reliable economic force in the global economy. While China slows down trying to control a renegade real estate market and Europe comes to the realization that incomes must be matched by productivity, the US remains the best and most desirable market in the world. People all over the planet are willing to buy our securities at ridiculous prices despite fiscal irresponsibility and political dysfunction. I believe that, at the end of the day, there are two great reasons that make all of it happen; and both are tied to American people.
Our companies are more innovative because our people. Our Retailers have experienced resilient sales thanks also to our people. Whether as a shopper or as an innovator, each American person has bought our incompetent government more time to try to get us back on track. Hurray for US Shoppers.
Our companies are more innovative because our people. Our Retailers have experienced resilient sales thanks also to our people. Whether as a shopper or as an innovator, each American person has bought our incompetent government more time to try to get us back on track. Hurray for US Shoppers.

No comments:
Post a Comment